Use Stacked Charts for Enhanced Visualizations
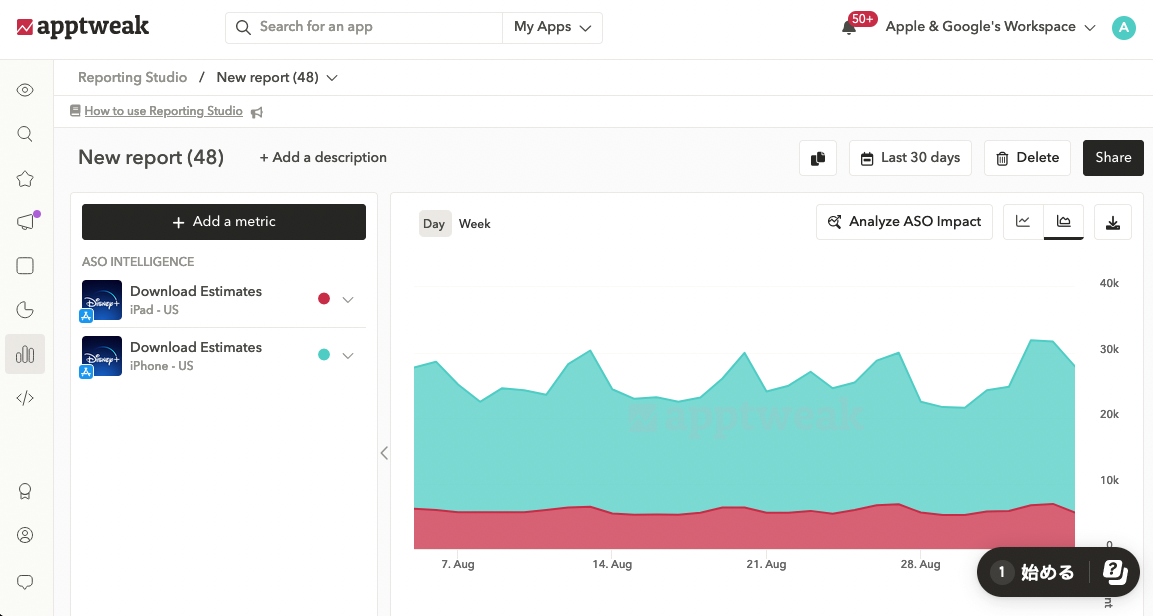
Stacked Charts allow you to very quickly aggregate your monitored data, providing an enhanced reporting visualization. With the tooltip, you can track each metric & total per day.
Technical info:
Stacked Charts are available for single metric types with a unit (y-axis) count, revenue, or cost.
Useful links: