Pie Charts
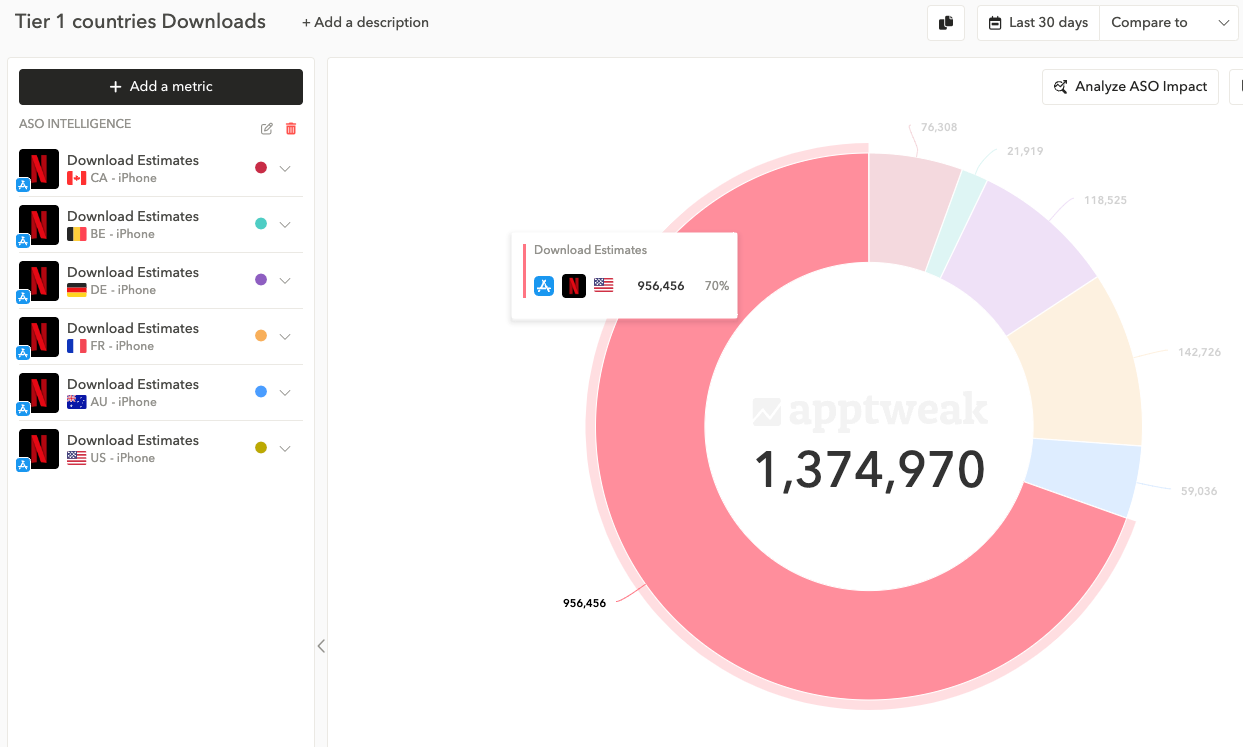
Pie Charts are now available, and are especially useful when you want to plot categorical data aggregated over time.
Technical info:
- Similarly to Stacked Charts, Pie Charts can only be used with quantitative metrics (e.g. unit count or revenues) but not qualitative metrics (keyword volume, category rank, etc).